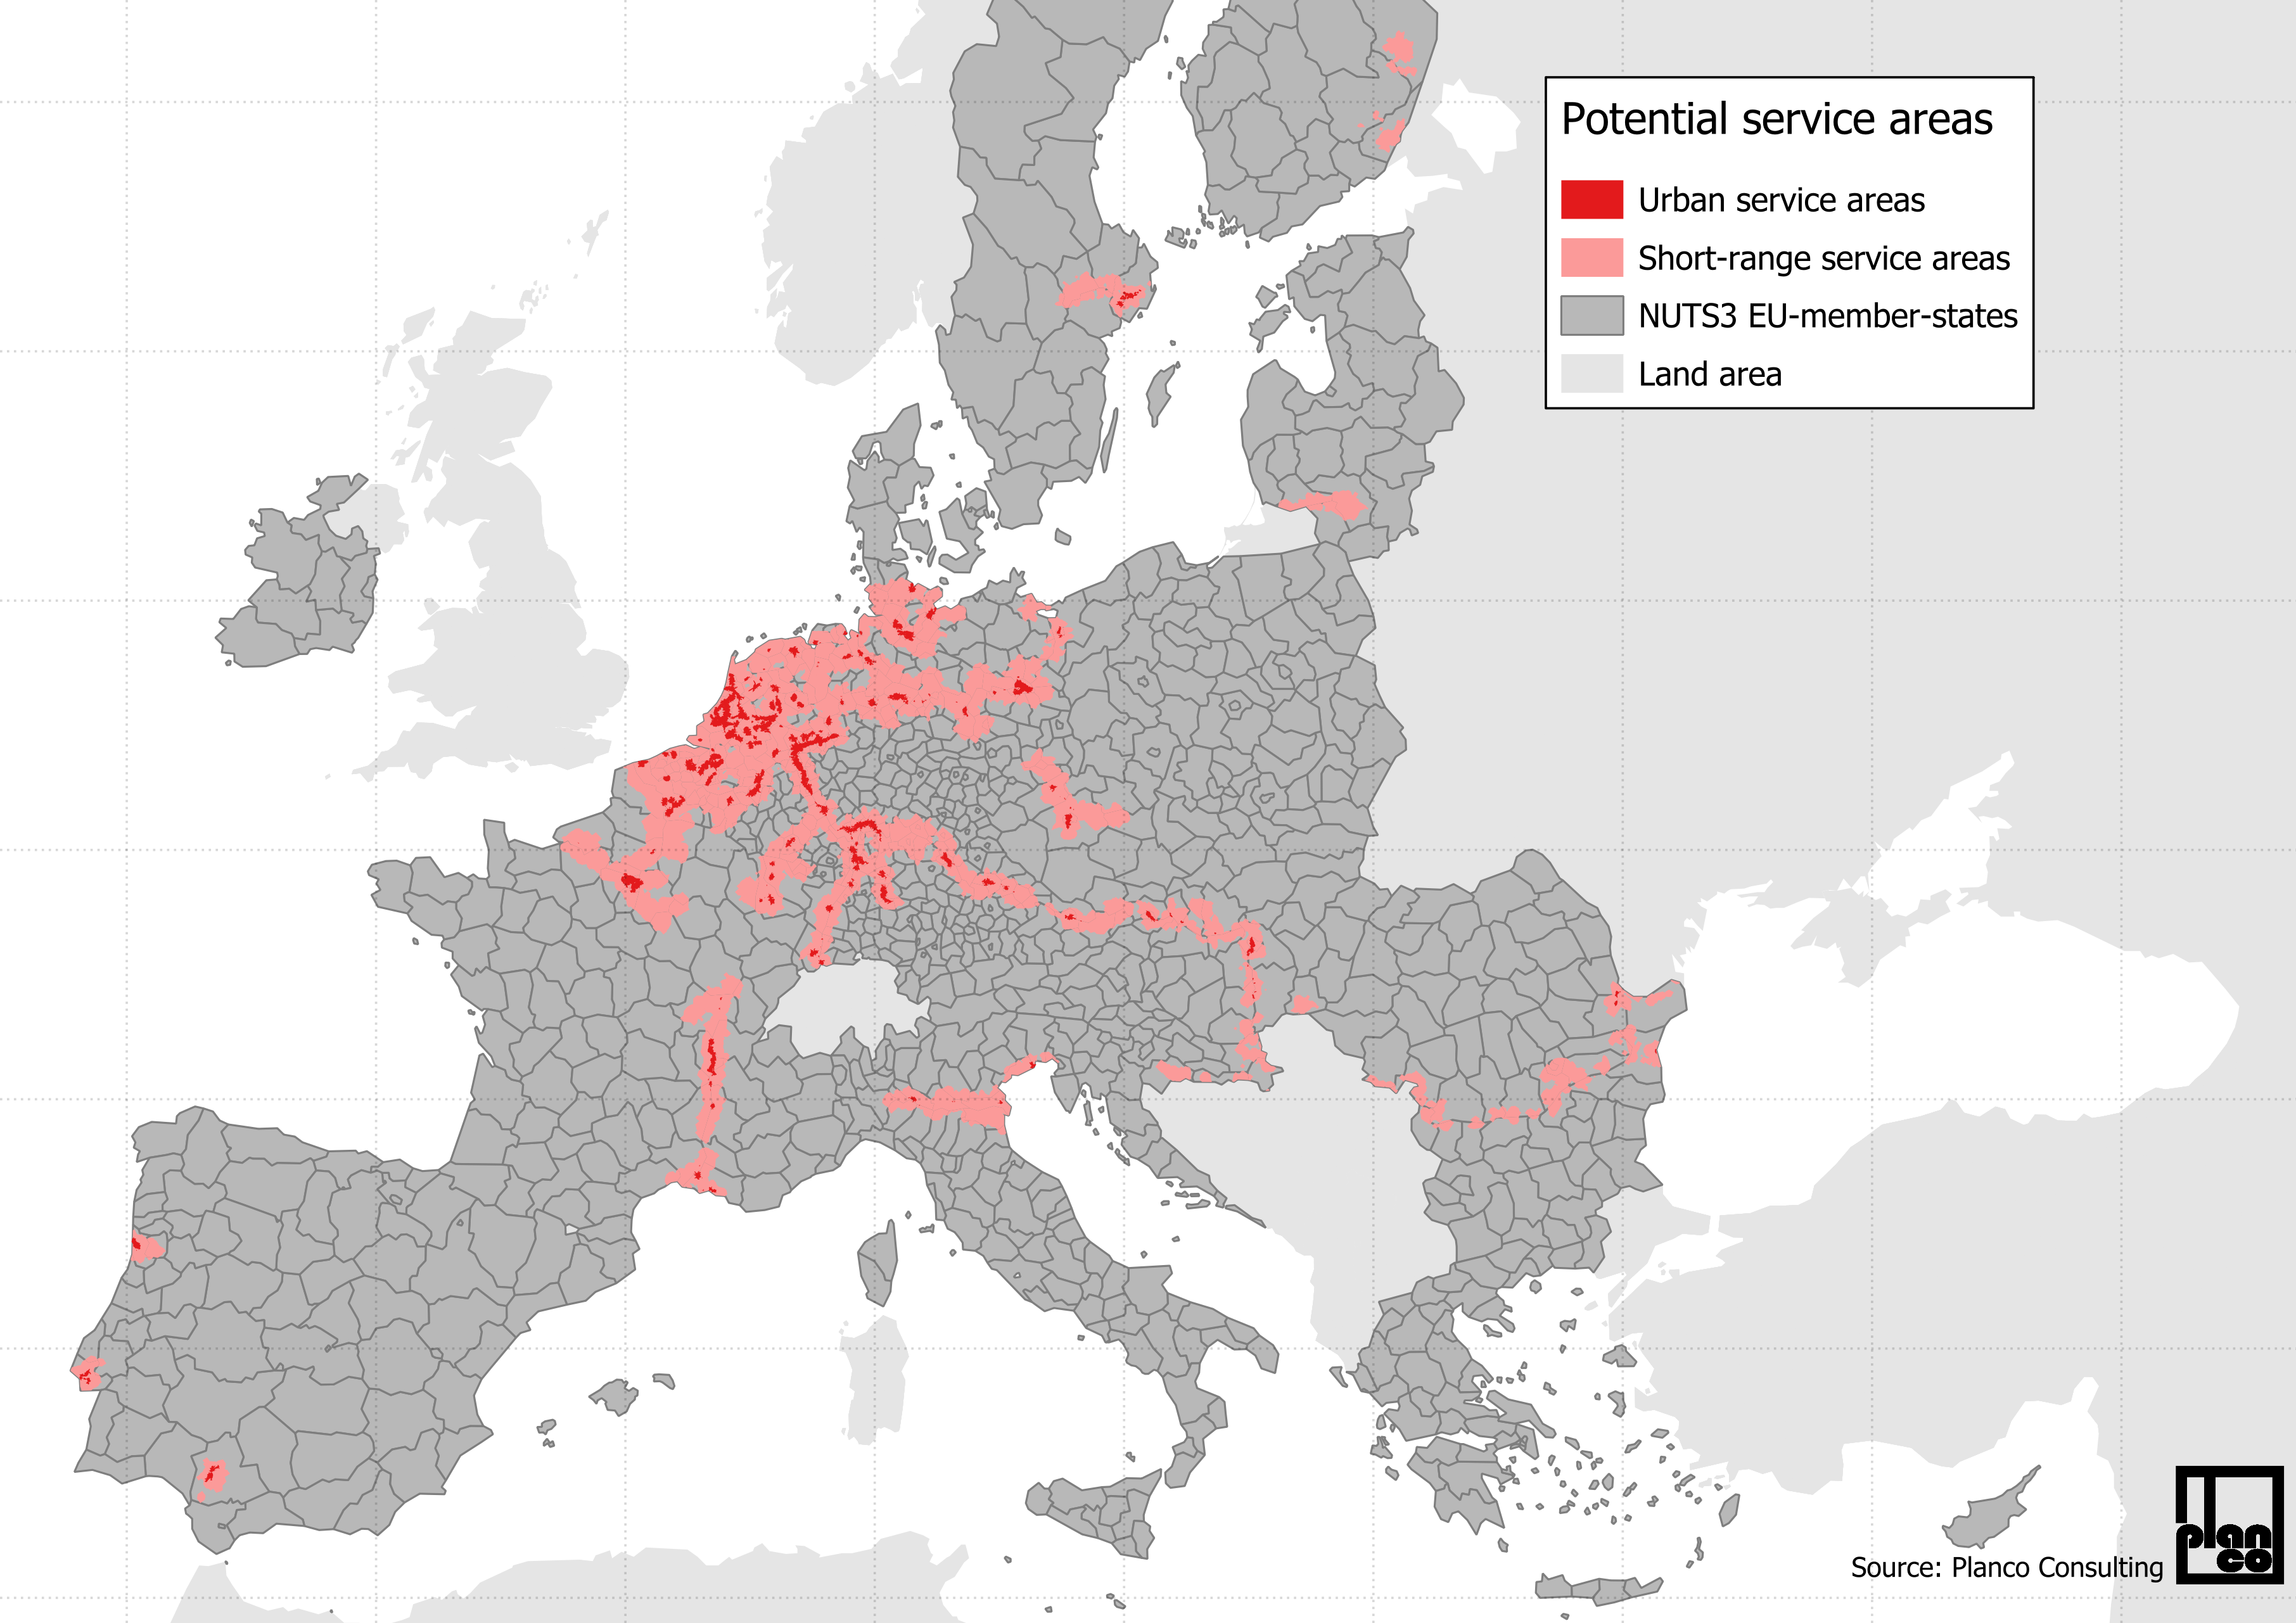
Map showing potential areas for urban and short-range IWT services
Procedure for creating the map
The map shows the spatial delineation/definition of European regions that we consider to be potential areas of possible urban or short-range IWT services. Both differ in factors such as range or last mile operation. The spatial delineation shown on the map was carried out using a computerised solution that was able to automate many of the calculation steps.
The basis for the delimitation was the Ten-T waterway and inland port network. Each harbour was automatically considered individually. A perimeter was selected to delimit the service area around a harbour. A radius of 20 km was selected for urban cases. This limit correlates with good practice cases in which deliveries on the waterway were also made within a maximum radius of 20 km.
A radius to 50 km was selected for short range cases, following the initial demarcation for short range transports and conventional transports.
Within this selected radius, waterway courses were cut out and broken down into waterway points. Each waterway point was considered individually as a potential last mile transhipment point, as there was a lack of data to exclude waterway points regarding this category. At each waterway point a delivery area of the last mile operation was drawn according to delivery time using an OpenStreetMap-based routing algorithm. [1]
For short range applications, a delivery time of half an hour with a motorised vehicle was assumed. For urban applications, a delivery time of 10 minutes by bicycle or motorised vehicle was assumed. This assumption of 10 minutes is also in line with good practice cases such as in Strasbourg, where even the delivery time is limited to 8 minutes, but also with further information from other stakeholders, who aim for more optimistic delivery times.
Delivery areas at the respective waterway points were analysed in terms of their population density to differentiate between urban and non-urban areas. A threshold of 700 inhabitants per square kilometre was selected. This corresponds to the average of three sources using numbers of the OECD[2], Eurostat[3] and the UN[4] on this topic. An overview of the various assumptions in the spatial delimitation of the IWT service areas is shown in the table.
| Assumptions | Urban IWT services | Short range IWT services |
| IWT delivery radius | 20 km | 50 km |
| LMO delivery time | 10 minutes | 30 minutes |
| LMO delivery modes | Motorized vehicles, bikes | Motorized vehicles |
| Population density p. square-km | >700 | >0 |
Within these areas, we have used Eurostat data to estimate the freight transport volumes that could be shifted from road to waterway. Results and explanations can be found in the Intermediate GRIP Report. Results of the short-range service include the results of the urban services areas.
What does the map show
The map illustrates potential areas for urban and short-range IWT services, which aim to shift transport to waterways and relieve pressure on roads. Short-range and urban transport rely heavily on road transport, yet many European cities are located on waterways, where examples of best practices already demonstrate the benefits of IWT in this segment.

[1] Giraud, T., (2022). osrm: Interface Between R and the OpenStreetMap-Based Routing Service OSRM. Journal of Open Source Software, 7(78), 4574, https://doi.org/10.21105/joss.04574
[2] Source: https://www.oecd.org/en/data/datasets/oecd-definition-of-cities-and-functional-urban-areas.html, last access: 14.8.2024
[3] Source: https://ec.europa.eu/eurostat/statistics-explained/index.php?title=Archive:Urban-rural_typology, last access: 14.8.2024
[4] Source: https://unhabitat.org/sites/default/files/2020/06/city_definition_what_is_a_city.pdf, last access: 14.8.2024


